We’re all seeing the fun investors are having in the big tech names today. Good times! The question is: what comes next for these steamrollers? Here are some chart-based reminders about a few of the top names:
MSFT
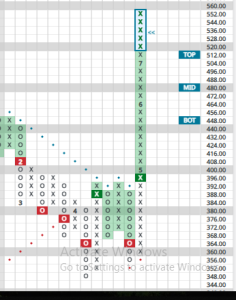
Following Microsoft’s impressive earnings report yesterday afternoon, the stock has experienced a powerful and well-deserved surge. As we step back from the positive headlines and look at the price action through the lens of our Point and Figure (P&F) methodology, the chart tells a very specific story.
From a technical standpoint, the stock now appears significantly overextended. We are currently looking at a vertical run that has produced a 25-box column of X’s. To put that in perspective: in P&F charting, an unwritten rule suggests that any trend extending beyond 13 boxes of X’s or O’s is typically a sign of exhaustion, where a pause or reversal becomes more likely. At nearly double that count, and with the price pushing above the top of its established trading band, caution is certainly warranted.
On the positive side is this: by some more conventional momentum indicators like MACD and Stochastics, Microsoft was actually becoming less overbought over the past 3 months, even as the stock continued higher over that time. That is typically very healthy action suggesting more upside is possible.
But the reaction to yesterday’s earnings has delivered more upside. While chasing this kind of momentum is tempting, our analysis suggests that the upside from the earnings announcement may now be largely priced in. Rather than a continued vertical ascent, the more probable scenario is a healthy pullback or a period of consolidation.
By no means am I saying MSFT’s bull run is over, but investors should keep in mind that the stock is now up fully 60% from is April lows! A move back toward the top of its recent trading band would be a logical first destination, allowing the stock to catch its breath after such a monumental run.
META
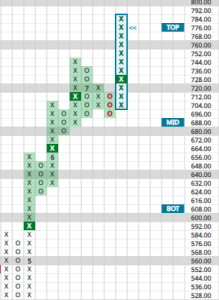
Shifting gears to another tech giant that reported yesterday, Meta Platforms (META) is also extended, but perhaps provides a more manageable technical picture.
While Microsoft’s chart looks vertically overextended, Meta’s setup appears more balanced by comparison. Sure, the stock has been on a relentless advance of its own but Point and Figure analysis continues to show a significant long-term price objective of $1012, with the now only slightly past the top of its expected current trading band at $776.
So, what about the potential risk following the earnings announcement? The chart provides us with very clear and strong support levels to watch, first at $696 and then again around $624, which marks the midpoint of its trading band.
From our P&F perspective, we would only become mildly cautious if the stock were to form a Double Bottom Breakdown sell signal. That would certainly put us on alert but would not shake us out; even if the post-earnings action stalls, the downside seems relatively contained for now. A pullback to the bottom of its trading band near that $624 level would likely represent a worst-case scenario in the short term. The current trend is so strong, it’s worth holding with that level as a downside in mind.
AMZN
Rounding out this week of mega-cap tech earnings is Amazon (AMZN), which is set to report after the closing bell today.
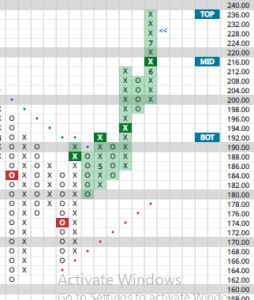
After bottoming in April along with the rest of the market, Amazon’s has been in a steady, methodical ascent toward its previous all-time high. Its move has been confirmed by five consecutive P&F buy signals on the way up. This pattern of persistent demand is encouraging and mirrors the healthy uptrend we’re seeing across many top-tier technology stocks.
Since it hasn’t yet broken to new all-time highs, however, traders will undoubtedly want to speculate ahead of earnings. That isn’t our game but here are a few thoughts to keep in mind.
Looking ahead to the post-earnings reaction tonight and tomorrow, there are two key levels to watch on a potential pullback. A decline below $200 level would be slightly worrisome as a double-bottom break. However, a more decisive move down into the $180s would be more significant, testing a major support zone on the chart while simultaneously becoming “oversold,” at least based on its current expected trading band.
So what’s a short-term trader supposed to do with today’s earnings play? Is a stop that’s fully 20% below the current price (based on a double-bottom break) comfortable for a short-term play? Here, you see just one of the difficulties of short-term trading – how to manage risk.
In our view, the better play for short-term traders hoping to catch some explosiveness is this: consider buying half a position if you must crowd in pre-earnings, then be willing to buy more should the next move happen to be a pullback. Stops will then become much easier to manage.
Amazon heads into its report with a strong and straightforward bullish chart. The question now is whether the results and guidance will be the catalyst for a breakout to new highs, or if a pullback will test the key support levels we have outlined.
Quick Recap
Ultimately, the technical picture for big tech is one of cautious optimism. While the powerful, long-term bullish trends remain firmly intact, the overextended nature of these charts suggests that patience and disciplined risk management will be crucial in the days and weeks ahead – particularly as we start to face the traditionally “scary” season on the calendar for stocks.