Trusted advice frequently says ignore the noise. This can be difficult anytime, but in the current environment it is exceptionally trying. We all have hard days. Maybe the weather is cold and rainy, preventing the puppy’s walk twice a day. Perhaps the muffler just fell off your car. I say this tongue-in-cheek, but it may be as good a reason as any to explain the extreme bearish sentiment that has been accompanied by an S&P 500 decline of only 6.3% off of all-time highs (intraday as of mid-day March 4th).
All these inconveniences alone would not be much, but when combined… things can get bearish for the investment outlook quickly. Political uncertainty, tariff concerns, growth-focused areas rolling over – all are a challenge to the last two years “markets go up” status quo.
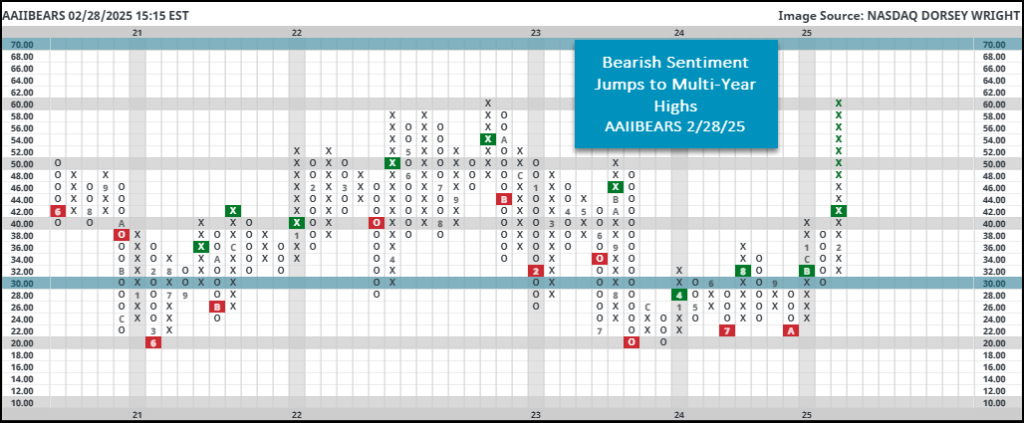
Look at the latest AAII Sentiment readings. Pollsters from AAII ask one simple question. “What direction do you feel the market will be moving over the next 6 months?” This simple question requires nuance in its interpretation. The history of the AAII Sentiment reading has shown a strong correlation to important market inflexion points…. i.e., market reversals. Successfully used in a contrarian sense, the current readings suggest an intermediate bottom is close. Look at the following chart, courtesy of friends at NASDAQ Dorsey Wright
More from Dorsey Wright..
“To put this in perspective, the historical “bearish” average (since 1987) clocks in at 31%. Readings at or above 60% are extraordinarily rare, happening a total of seven (including this week) times since the start of the dataset. That is roughly 0.36% of the time. The reading is the highest since September of 2022. Before that, chart levels >60% were untouched until March of 2009. Point being, people being this negative on the stock market is quite unusual.”
Further backing the input from Dorsey Wright above, here’s a look at forward returns after extreme AII sentiment readings:
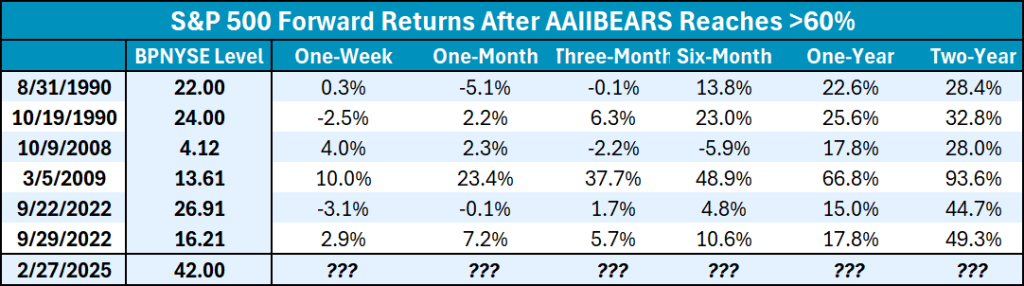
Readings tend to cluster together around these key reversals as they did in 1990 and 2022. While the S&P tends to rebound slowly, the farther out, the better performance. In 1990 we were at the start of the decade long bill market highlighted by the strong back-to-back to back-to-back years of 1995 – up 34.11%, 1996 – up 20.26%, – 1997 – up 31.01%. 1998 up and 1999 – up 19.53%. History does not always repeat itself and one should be aware of cherry-picking data to confirm one’s bias as this is a small data set.
While we consider these sentiment readings to be secondary indicators, useful in compiling a “weight of evidence” scorecard, our disciplined approach to the markets pays close attention to overall market trends and relative strength readings. If a security is in a clear uptrend and has stayed consistently above the upward sloping trend line, then we would consider adding it to our holdings. Successful challenges to those key support levels are also vital. Strong stocks often go right to the support line hold that line in the sand before reversing and heading higher.
Of course, we will have to wait and see how the decade plays out after the important bottom of Q3 OF 2022. For what it’s worth, we are still in the Roaring 2020’s camp and expect strong markets in the years ahead. Expect periods of intense drawdowns like we are in currently. However, the remainder of this decade should dramatically reward investors with a longer-term holding period.