Let’s summarize this post right up front: I’m going to show some foundational technical indicators at a very high level to explain why I don’t believe this market is at risk of a devastating selloff.
Why do I write this now?
Because bearish predictions seem to have become all the rage in recent days:
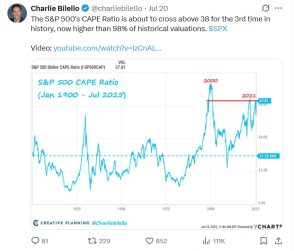
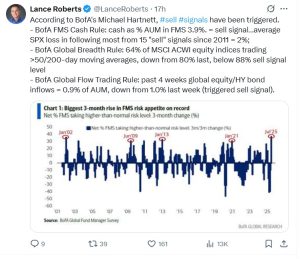
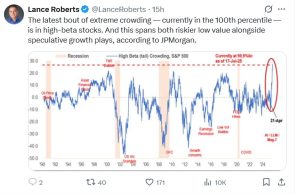
In a way, I don’t blame these pundits, both of whom I think highly of, in fact. I do suspect, however, they’re falling into a trap.
Here it is: because we’ve seen such a powerful rally since the “Liberation Day” tariff lows in April – a bounce that has seen the S&P 500 jump by 30% in just over 3 months – stocks just have to pull back in a meaningful way, don’t they?
Not necessarily.
Sure, traditional seasonality and the historically weak months of September and October are just around the corner. Oh, wait: unfortunately, the ‘seasonal weakness’ belief is a myth, one we exploded more than two years ago.
Maybe they panic-sold at the April lows and are now desperately hoping for a pullback? I don’t know but regardless, today’s market simply is not set up for a collapse.
A brief pullback, perhaps? Sure, but let me show you some fundamentals that matter in our style of analysis.
The 30 and 70% Levels
In Point & Figure technical analysis, these two figures carry a lot of meaning in most of our indicators, with 30% representing oversold levels and 70% representing overbought. Forget charts, don’t worry about what each indicator I’m about to show you means and just take me on faith for a moment.
In my comments below, I’ll be referring to the following breakdown of NY Stock Exchange indictors:
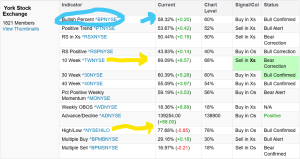
First, look at the two yellow arrows. These represent our most valued short-term indicators.
I said above that the 70% level represents overbought territory so, yes, these two indicators are mildly overbought. I say “mildly” because they move quickly and in the case of such short-term gauges, they aren’t extremely overbought until reaching into the high 80s or low 90s.
Still, the market is getting somewhat extended on a short-term basis, something our social media friends above are undoubtedly feeling.
Longer-term, however, things aren’t wildly extended.
Please look now at the blue arrow. This one points to the most basic LONG-TERM indicator in Point & Figure analysis, the Bullish Percent. While this indicator has moved above the midfield level, it is nowhere near a grossly overbought level in the 70s.
So, what does all this tell us on a very basic level?
Our friends could be right: the market might indeed find a reason to sell off. However, because short-term gauges aren’t extreme and the longer-term picture is not grossly extended, we expect any pullback that might materialize to yet again be short-term and mild in nature.
Get precious with your trimming and make a lot of portfolio moves if you must. Just be warned: any selling you might do now will likely take place within the context of a bull market that continues to roar.
Our “Roaring 2020s” thesis remains fully intact.