With the recent stock market craziness, we can’t go through this week without chiming in with a few thoughts.
As we’ve watched the wild swings of the past few days, conflicting emotions emerge. While we’re encouraged by the oversold condition of stocks currently, we’re reminded that not all bottoms are quick and easy.
Some are, undoubtedly. The Covid low, the Long Term Capital crisis of 1998… these were short, swift drawdowns that one could have blinked and missed.
Others are trickier and take more time.
Investors who were around for the Great Financial Crisis recall the brutal market of 2008 – and the relief that came when TARP was finally passed in early October. The stock market breathed a sigh of relief and bottomed.
Except it didn’t.
Go back and look to remind yourself: the low didn’t come until fully five months later, and after a further 25% decline in the Dow!
I have been openly bullish since October 2022 and came into this year expecting positive returns. That said, a lot of damage has been done in recent weeks. Heck, in recent days. Carnage like this can take the market longer than expected repair and start climbing to new heights.
All that said, let’s look at the positive: the market is very oversold, not only on a short-term basis but according to longer-term indicators, as well. Encouraging.
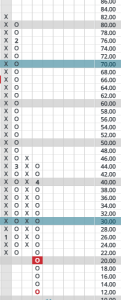
Here’s a key short-term indicator, the NYSE HILO:
And this is the 10 Week, another short-term gauge:
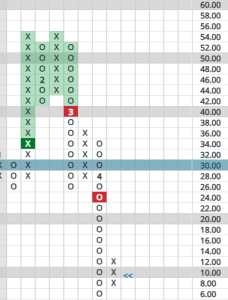
Clients are familiar with these two indicators: oversold status begins under the 30% level, while overbought starts above 70%. With these two indicators, however, they can go to single digit extremes on the lows. Today’s status, then, indicates that supply is somewhere in the vicinity of washed out, which is encouraging.
Because these indicators can go even lower, and have, we want to see a rising column of Xs exceed a prior column of Xs before declaring a Bull Confirmed status. That could happen by a rise past the last column of Xs you see in each chart above, or with more backing and filling, which would mean more volatility would first be needed. The current rise would halt and it is this most recent column of Xs that would need to be bested for the bull to commence. Pullbacks in the meantime could bring more pain.
Looking at the longer-term chart, the NYSE Bullish Percent, we see another indicator that has fallen into oversold territory.
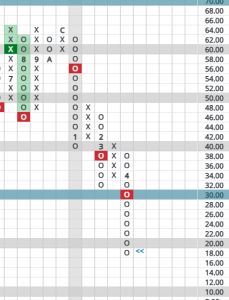
With this important long-term indicator, which simply measures the percentage of stocks that are on Point & Figure buy signals, single-digit washed out conditions like the shorter-term indicators above are not common. Any reading below 30% is an oversold condition worth getting excited about.
Unless so much damage has been done that a lot of base building – backing and filling – may be needed.
As an aside, short and long-term indicators for the NASDAQ look similar currently.
If a gun were put to our head and we had to choose between buying and selling today, the oversold conditions mean we would lean toward buying. We are leaning that way currently.
Still, investors who have liquidity available and who want to accumulate shares here should not expect to time things perfectly. And they should be willing to endure a little more pain along the way, if needed.
To explain why, I’ll point briefly to another bear market that should still be fresh in everyone’s minds: the inflation scare market of 2022. In that case, all the indicators I highlight above reached similarly oversold levels as early as April of that year.
The low didn’t come until October – nearly 20% lower on the Dow.
To summarize, there’s some very good news developing: markets are deeply oversold, meaning supply is getting exhausted and demand (buyers) should soon be able to drive stocks higher.
“Soon,” however, could be measured in months, not days.