Nvidia’s latest earnings report sparked a fascinating, and telling, two-part reaction from the market. The initial knee-jerk response in the after-hours session was met with a collective shrug—a surprisingly lukewarm reception to another strong quarter. However, as investors had time to digest the company’s forward guidance, a more optimistic sentiment took hold in this morning’s pre-market trading.
The underlying message from the report eventually became clear: the AI boom is still unfolding. While investors are becoming a little more cautious about this powerful, forward-looking narrative, there seems to remain much optimism around NVDA stock itself.
With all this news-driven volatility, how do we separate the signal from the noise? To find clarity, we turn to the Point & Figure chart. By focusing purely on price action, the chart below helps us cut through the short-term reactions and identify the key, objective levels that will allow us to act.
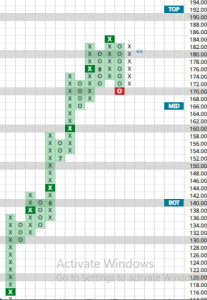
So, what are the key risk levels to watch on the downside? A more muted, healthy pullback would likely find initial support around the $168 level, with a secondary floor of support at $164. These are the near-term areas where buyers would be expected to show interest.
A more serious breakdown, however, would put the longer-term trend at risk. The price action that should make investors nervous would be a failure to hold the bottom of the trading band at $140. A break below that level could open the door to a much deeper correction, potentially down to the primary bullish support line at $104.
While a drop of that magnitude may seem far-fetched given the AI excitement, it’s worth remembering that we are heading into September and October, which have historically been the most challenging months for the broader market.
On the upside, the picture is much simpler and speaks to the stock’s underlying strength. A decisive move and hold above the $186 level would be very constructive, marking a new all-time high for the stock.
Such a breakout would confirm that the primary uptrend is resuming and would bring new, higher price targets into play. Should that action take place, we will update our analysis with those new P&F price objectives.
Ultimately, how you interpret these levels depends on your own investment horizon. The key is to determine your own strategy before the market makes a move for you.
Are you a long-term investor focused on the multi-year AI story, willing to ride out significant volatility? Or are you a more opportunistic trader looking to profit from the peaks and valleys along the way? Answering that question will provide the clarity needed to navigate what comes next for Nvidia.