s the recent rally in stocks telling us there will be a profits boom in 2024? I’m having a hard time shaking this idea lately, but let me first deal with two shorter-term issues, one that’s a little bearish and one that is yet to be resolved and which bears monitoring.
In the short run, it’s easy to be negative toward the market. Stocks have arguably rallied too far, too fast; even factoring in yesterday’s sell-off, the S&P has screamed nearly 15% higher since its late October low. Investor sentiment, which I value less than actual stock market action, is inarguably “too bullish.” And even some of my favorite short-term Point & Figure indicators are stretched to the high side at the moment.
Fine: if you’re a short-term trader, it makes sense to be locking in some of your recent gains.
But what if you take an intermediate or longer-term view toward investing?
The Question of Copper and Gold
The orange line in the image below represents the copper-gold ratio, obtained by dividing the price of copper by the price of gold and plotting the daily readings. A rising ratio indicates that copper is outperforming gold, while a falling ratio suggests that gold is outperforming copper.
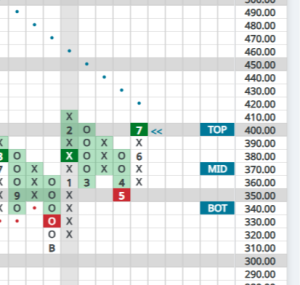
Courtesy of NASDAQ Dorsey Wright
The significance lies in the fact that gold is widely considered a safe haven based its role as a store of value and due to limited industrial and economic applications. Rising gold prices often signal economic contraction or investor fear. Conversely, copper, a vital industrial metal widely used in construction and electronics, tends to excel in a robust economy or in anticipation of economic strength.
The grey line on the chart corresponds to the US Treasury 10YR Yield. Notably, interest rates exhibit a parallel relationship with the copper-gold ratio. This correlation aligns with intuition, as rising interest rates typically coincide with economic expansions while declining rates are characteristic of accommodative monetary policy amidst economic weakness.
The key takeaway is that the copper-gold ratio has been in a mild downtrend since early 2022 and currently displays no technical signs of reversal. After having overshot to the upside during the Fed’s hiking cycle, interest rates have of course pulled back substantially in recent weeks.
Still, there remains a measurable gap between the orange and gray lines. The question is, how will that gap be closed? If my next thesis is correct, rather than seeing interest rates plunge even further, perhaps they’ll fall more slowly than expected and at the same time, we will see a rise in that copper gold ratio to close the gap between the two lines – signaling a pickup in economic activity.
Longer-Term: What is the Recent Rally Telling Us?
Perhaps, as bears suggest, the stock market rally we’ve seen over the last six weeks has been a total head fake. Maybe it’s all one big, false rally that is suckering investors into a mess ahead of 2024. Maybe recession will hit next year.
But what if that isn’t the case? I work so hard on technical analysis and follow charts because I believe future fundamental conclusions are easiest to draw based on today’s stock market action.
So what could the recent rally be telling us? Perhaps it’s saying 2024 corporate profits will boom.
Think of it for a moment: haven’t we all completely lost track of the prices of day-to-day goods and services?
Gasoline prices that would have offended us three years ago, we now hardly think about. Twenty-two bucks for a cheeseburger at the local hole-in-the-wall? Pretty standard. And good luck getting out of the grocery store for less than $100, regardless how short your shopping list.
As the supply chain broke and input costs soared, businesses of all types aggressively pushed prices to stay ahead of runaway inflation. But something very clear, and potentially powerful, has happened beneath the surface over the last year and I think it’s setting companies up for surprising bottom line expansion.
Natural gas is down by over 60% in the last year.
Terrorist-led disruptions to global shipping are making headlines today but it’s little noticed that container shipping rates are down roughly 90% from their 2021 peaks.
Copper isn’t down a ton over the last year but is off over 8% from its January high.
And crude oil has fallen nearly 20% since it’s September peak three months ago.
In short, these and other key inputs that act like drags on the economy when they’re rising have backed off dramatically – and with little notice.
Meanwhile, are you seeing any pullback in consumer prices? Of course not.
Once consumer prices get set, corporations don’t tend to give those levels back very easily. This means that we could see a huge profits boom from these corporations that have raised their prices to fend off the inflationary wave and are now going to keep them elevated despite the pullback in many of their core inputs.
So, how does this translate to valuations?
If we take a 2024 estimate of $250 in earnings for the S&P 500 from someone like Ed Yardeni, among the more bullish voices out there currently, that means the market is only trading at P/E ratio of 18.8 today. Over, say, a 100-year history of the stock market, that sort of level might be considered high but it would actually be on the lower-middle end of the range we’ve seen in P/E ratios over the past 25 years.
In short: either the recent stock market rally meant nothing and was a head fake, or it meant something.
Assuming it shouldn’t be ignored, I suspect that the stock market rally we’ve seen recently is telling us we’re going be surprised by something on a macro level, and my guess is that S&P earnings estimates are too low.