We define the Santa Claus rally period of December 15th to January 15th. Traditionalists consider the Santa Rally Period December 15th to December 31st. In our blog post of December 14th (“Santa Claus Rally & The January Effect”), we discussed the block of time from December 15th to January 15th. This period is the tail end of tax-loss selling and the start of the “view from the windshield as opposed to the rearview mirror” period.
How has this year’s version of our Santa period gone?
Quite good, and in line with the recent historical returns. The returns have been 2.65%.
How has the January Effect gone so far this year, and is the effect really borne out in the data?
It has long been said “As January goes so goes the year goes”.
While the adage has an attractive success ratio, it is certainly not fail-safe. Of course, past performance is no guarantee of future results. According to Nasdaq Dorsey Wright:
“In fact, 7 of those 12 years where the barometer has been “really wrong,” have occurred since 2009, including 2014, 2016, 2018. 2020, and 2021. In 2018, SPX started off strong, gaining 5.82% in January, but finished the year down more than 11%. Back in 2016 SPX fell more than 5% in January, the seventh-worst January on record since 1950, before rallying to finish the year with a gain just shy of double digits. Other large discrepancies between January and full-year returns occurred in 2009, 2010, and 2014.”
The “wrong bias” tends to give support to being “wrong positive,” that is, a negative January has posted a positive full year 9 out of 12 times. Still strongly stacking odds in investors’ favor.
There is research to support the January bias using historical data going back to 1950, and we have outlined some of the more relevant bullet points below.
January Barometer Stats (as per Nasdaq Dorsey Wright):
- When the S&P 500 records a gain in January, it has recorded a gain for the full year over 88% of the time (38 out of 43).
- The “barometer” has been more accurate predicting up years than down years. When the S&P 500 is down in the month of January, it has finished down for the full calendar year 52% of the time (15 out of 29).
- The average return for years starting with a positive January is +16.64% for the year.
- The average return for years starting with a negative January is -1.74%.
- The barometer has been “right,” either to the upside or downside, about 73% of the time (going back to 1950).
- There have been 12 “really wrong” years, in which the SPX has logged a gain or loss of more than 5% in the opposite direction of January’s return.
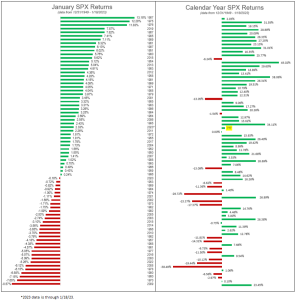
The below graph show the prior 73 years of data to reflect the actuality of the January Barometer. To read more about this concept, you can review this piece published by stocktradersalmanac.com.