Silver is the penny stock of precious metals — it moves last and biggest at the end of precious metals bull markets.
It happened in the 1970s and it happened again as the last gold bull market neared its end in 2010/2011. For example, gold rallied 50% over the final year of that run but during the same timeframe, silver tripled.
In retrospect, that parabolic rally in silver was the clear signal that the precious metals bull market was meeting its end.
Forward to today: the extraordinary run in we’ve seen in gold over the past 14 months has kept the yellow metal in daily headlines.
However, what’s gone unnoticed over the same period is the fact that silver isn’t moving.
Now let me clarify: yes, silver is up 50% over that timeframe. But gold has gone up by 70%.
Wait, that’s similar-sounding performance… not so bad, right?
Actually, it’s quite strange. I’ll come back to why silver’s underperformance is odd in a minute.
First, to get a background sense of why today’s setup is so strange, one must look at both absolute prices and the gold/silver ratio.
Regarding absolute prices: When the 2011 precious metals bull died, gold peaked at ~$1600. Silver nearly hit $50. Put another way: today, gold is nearly double its peak of 14 years ago while silver is still over 30% below its all-time high!
Regarding the gold/silver ratio: it stands today just over 100, a stratospheric print meaning one ounce of gold could buy more than 100 ounces of silver. The historical midpoint is ~60 and this ratio can hit as low 20 when gold is cheap compared to silver.
Today, it’s silver that is the inexpensive precious metal.
So, how will this divergence close?
Precious metals bulls point to silver and say that because it hasn’t yet rallied, there is not only more room for the metals to run but silver is a screaming buy that will play catchup and will deliver returns beyond one’s wildest dreams.
Others, meanwhile, would say the situation is simple: gold is grossly overextended today, mostly due to political instability that should prove fleeting, and is due for a massive correction.
Who is right? Fundamentally, silver’s beauty is in the eye of the beholder. Instead of winging out another opinion on monetary policy, geopolitics and all else that fuels movements in precious metals, let’s see what supply and demand say by looking at the charts.
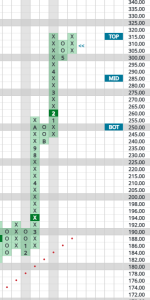
GLD
Looking at the ETF that tracks the price of gold, it’s obviously up on a stem since its breakout in March of 2024. Recent action around the $315 area is exactly what I would expect, backing and filling, consolidation at the top of the trading band. If I had to wager, I’d say the next move would be a further absorption of the last 18 months move and a reversion down to the midpoint of its trading band in the $250 range.
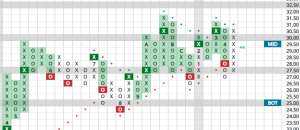
SLV
Where has the expected silver blowoff been? Absent. Is the blowoff top coming? We would be more confident if SLV took out past resistance in the $31 to $31.50 range. We then could say the parabolic run is in play again as that break out could lead to a high $30’s price objective.
Fundamentals, politics and geopolitics aside: it’s hard to suggest chasing precious metals today unless silver shows more signs of life.