In our most recent weekly newsletter, we featured an article we thought readers would find insightful for its interesting take on a narrow pricing signal coming from the heavy machinery industry.
**Not currently a subscriber to our free weekly investment newsletter, Cultivate & Harvest? We’ve got some great news: you can sign up via the following form!
The post cited Goldman Sachs, which made the case that because dealer inventories were shrinking, higher prices were likely. In their opinion, this meant higher prices would soon be seen in the used machinery markets, as well.
It sounded rather bullish for such manufacturers so we decided to see if charts reflected any of this positive shift.
Sure enough, the market was ahead of the headlines – even one based on a clever, forward-looking datapoint.
Let’s take a look at DE, for example:
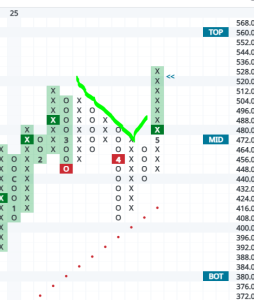
Keep in mind: numbers in Point & Figure charts represent months, so the most recent ones you see are 4 & 5 for April and May.
Not surprisingly, DE crumpled briefly immediately following the Liberation Day tariffs announcement. However, its rally since has been strong enough to power through an established, negative trend of lower highs and lower lows. A further rally from here to the top of the trading brand would get pretty extended and shouldn’t be chased, while a pause or pullback in the near-term could offer a buying opportunity.
The thrust that broke the downtrend is called a Bearish Signal Reversed, which suggests things are indeed changing for the better for Deere – just like the insight from Goldman suggested.
By the time you’re reading the news about a company, you’re late. Based on this action, we would expect more positive developments to start revealing themselves in Deere’s numbers, because market action almost always leads fundamentals.
…part of the reason we focus so heavily on technical analysis rather than just fundamentals alone.