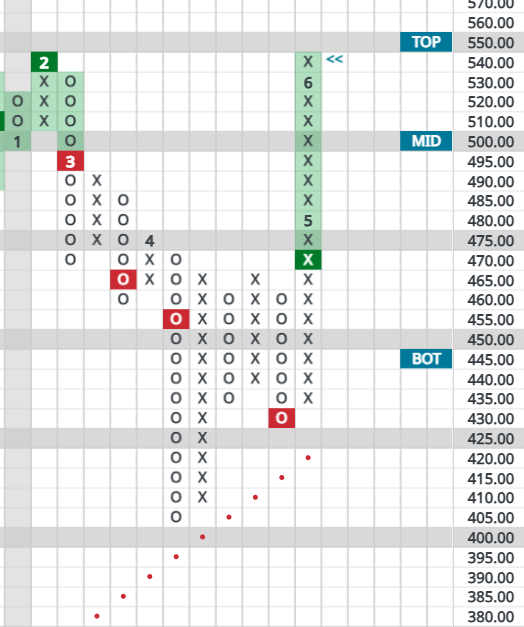
After a small third quarter correction and a rough start to October, stocks staged a robust advanced for 8 straight sessions prior to today’s pullback.
Jump in? Too late to chase? How should investors act now?
Before giving our view, let’s look at a couple of competing perspectives – one current, one that still resonates from the past.
Most skeptical of this rally are fundamental-only strategists like Morgan Stanley’s Mike Wilson, who swears this rally won’t last.
“Rally will fizzle out in a week or two, Morgan Stanley strategist Wilson says,” blared a recent headline. The article continued:
“Technical and fundamental support is missing, wrote Michael Wilson in a research note Monday. Citing a gloomy earnings outlook, weaker macro data and deteriorating analyst views, “we find it difficult to get more excited about a year-end rally,” he added, noting that the gain “looks more like a bear market rally rather than the start of a sustained upswing.”
With all due respect to Mike: technical support is missing? It always interests me when those who focus on fundamentals voice their opinions regarding technical analysis. What Mike Wilson worries about are interest rates, Israel, consumer credit, the housing market, national debt, etc. These are all valid fundamental concerns but they’re also already known to markets.
If he truly analyzed supply and demand through technical analysis, Mike would have seen some of the same key things we’ve been suggesting for a year:
- October, 2022: Stocks bottomed last October (Nervous? Perfect! Time to Buy)
- January, 2023: Growth stocks are favored (Growth vs. Value: Has the Baton Been Passed?)
- May, 2023: Stay the course (Sell in May and Go Away? Not Anymore)
- July, 2023: A pause is likely (Short Term Precision Needed, Bulls Still in Control)
…and now? All meaningful short- and long-term indicators have reversed up from oversold levels they quickly achieved during the third quarter’s rather healthy pullback. If stocks take a near-term breather, it will be perma-bears like Morgan Stanley’s Wilson who will be caught off guard. Selling had gotten so exhausted recently that any pullback that might happen from here will be a welcome chance for investors to add to positions.
The Mike Wilsons of the world make for great headlines but I’m not sure they add a lot of value to investors’ portfolios.
Let’s now pivot and look to an unusual indicator crafted by a true market legend, Marty Zweig.
Recently, an obscure indicator called “The Zweig Breadth Thrust” has snuck into a couple of news stories. What is it?
A Zweig Breadth Thrust is relatively uncommon because it requires a period of extremely widespread selling, immediately followed by a period of extremely widespread buying. The measure is calculated by dividing a moving average of all advancing NYSE stocks by the total number of advancing plus declining stocks. Furthermore, the Zweig Breadth Thrust triggered on Nov. 3 is just the 18th since 1945.
According to Carson Investment Research, the S&P 500 has been higher one year later 100% of the time, with an average and median return of about 23%!
For the youngsters who don’t know him, Martin Zweig was a highly successful investor who began publishing a stock market newsletter in the 1970s. A frequent contributor to Barron’s and guest on Louis Rukeyser’s Wall Street Week, Zweig was well known for predicting Black Monday in 1987, when stocks lost over 20% in one day. His book, “Winning on Wall Street,” is a staple in investor libraries.
Before 24/7 news cycles and round-the-clock trading, I rarely missed Louis Rukeyser’s Wall Street Week every Friday night at 8:30pm (before I went out and rabbled roused). Zweig was a luminary and I still remember well his demeanor during the show following the ’87 crash.
So, to whom should we listen? Today’s fundamentalist who is terrified of all the same scary headlines we could paralyze ourselves over without anyone else’s help? Or on an emotionless discipline like technical analysis, highlighted by the calm calculations of a legend like Marty Zweig and meaningful indicators discovered by people like him?
I’ll take the latter, thank you very much.
Ultimately, today’s market is still in a strong uptrend that started over a year ago. Seasonal factors are with investors. The presidential cycle is with investors. And all key Point & Figure indicators are with investors.
Simply put, investors can add to any short-term trading positions and can stick with core, long-term portfolio holdings.
Onward.


