Point and Figure (P&F) charts are a unique form of technical analysis that filter out minor price fluctuations and time, focusing solely on significant price movements. While traditional “trading bands” like Bollinger Bands are commonly associated with time-based charts (like candlestick or bar charts), a similar trading band concept can also be applied to Point and Figure charts, which are based on price movements, though with some important considerations.
Here’s how trading bands relate to Point and Figure charting analysis:
Understanding Point and Figure Charts First
Before diving into trading bands, it’s crucial to understand the basics of P&F charts:
- X’s and O’s: P&F charts consist of columns of “X’s” representing rising prices and “O’s” representing falling prices.
- Box Size: Each X or O represents a predefined “box size,” which is a specific price increment. Only price movements equal to or greater than the box size are plotted.
- Reversal Amount: A new column (and a reversal from X’s to O’s or vice-versa) is initiated only when the price reverses by a specified “reversal amount” (typically three boxes).
- No Time Axis: Unlike other charts, P&F charts don’t have a linear time axis. They only move forward when a significant price change occurs. This helps filter out “noise” and highlight important trends and patterns.
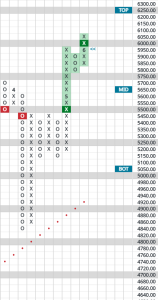
Here’s a chart with a fairly wide trading band currently, the S&P 500, as shown on the right side of the image (Top, Mid, Bot):
Trading Bands in Point and Figure Analysis
While P&F charts inherently identify support and resistance levels through their pattern formations (e.g., horizontal lines of X’s or O’s), trading bands can be overlaid to provide additional insights into volatility and potential overbought/oversold conditions.
- Trading Bands in P&F: Bands are calculated based on the average price over the past 30 days rather than daily or weekly closing prices. This means the underlying moving average and standard deviation calculations adapt to the unique “event-driven” nature of P&F charts. The ranges you see on the right side of our charts are one standard deviation from the current price based on the stock’s own beta, or volatility.
- Double Smoothing: Because the P&F chart itself already filters price movements, and then a moving average is applied to the column averages, it creates a “double smoothing” effect. This means that shorter moving average periods (e.g., 5 or 10 periods) on a P&F chart with Bollinger Bands might produce signals similar to much longer moving averages on time-based charts.
- Interpreting Signals: Core interpretations of trading bands include:
- Narrowing Bands (Squeeze): Indicate low volatility. A breakout from that range could signal that a significant price move (breakout) might be imminent. However, the direction of any potential breakout is not indicated by the bands alone.
- Price Touching/Moving Outside Bands: When the price touches or moves outside the upper band, it suggests the asset might be overbought and poised for a potential reversal or pullback. Conversely, touching or moving outside the lower band suggests an oversold condition and a potential buying opportunity.
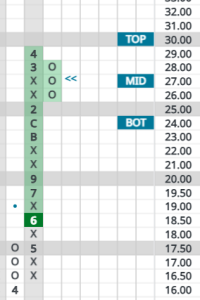
A stock with low volatility and, hence, a narrow trading band (AT&T/NYSE: T):
Benefits and Considerations
- Clearer Signals: Combined with the noise-filtering nature of Point & Figure charts, trading bands do not signal whether a stock is a buy, sell or hold, but they can aid in timing of entry and exit points.
- Volatility Insights: Trading bands add a layer of volatility analysis to the pure price action focus of P&F charts, helping traders understand whether the stock or ETF they are looking at is volatile.
- Support/Resistance Confirmation: Sometimes, bands can provide additional confirmation for the support and resistance levels identified by P&F patterns.
- Customization: The box size and reversal amount in P&F charts, along with the period and standard deviation settings for the trading bands, allow for significant customization to suit different trading styles (short-term vs. long-term) and asset characteristics.
Important Note: While trading bands can be a useful addition, the primary strength of Point and Figure charting lies in its ability to highlight significant price action trends, and classic chart patterns (like double tops/bottoms, triple tops/bottoms, and various breakout patterns) by filtering out market noise. Trading bands augment this analysis by providing a measure of volatility within that filtered price environment.