We’ve been anticipating a spike in market volatility from late October to early November. Investor anxiety over third-quarter earnings and the upcoming election is casting a shadow. Historically, the fourth year of the Presidential election cycle sees a “wait until all the ballots are in” approach. However, this year’s market behavior has deviated from the usual election cycle trends.
Can the VIX (Volatility Index) predict what’s ahead? For context, the VIX is calculated using the implied volatility of S&P index options expiring in the next 30 days. On Monday, October 8th, options expiring after Election Day were included in the VIX for the first time. That day, the VIX surged by 18%, signaling the onset of Q4 concerns.
Here’s more election year history from our friends and partners at NASDAQ Dorsey Wright:
“This year, there is perhaps more uncertainty than usual about the outcome of the election as many polls have shown that the race is a dead heat. With odds between the candidates roughly evenly split, should we expect to experience more volatility than unusual this year? Would there be less volatility leading up to election day if one candidate was leading by 10 points?
“To get a better understanding of how the state of the race affects the state of the market we looked at the final polls for every election since 1952 (and polling averages for the two most recent elections) and the returns and volatility of the S&P 500 in the October before; we used two methods to gauge volatility – annualized standard deviation of the daily returns for the month and index’s range for the month – calculated as the high minus the low divided by the prior month’s close. The results of our study are shown in the table below.”
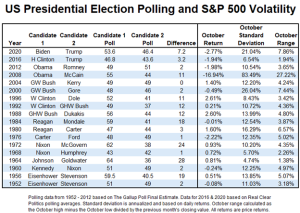
NASDAQ-DWA continues…
“Our hypothesis going in was that we might see increased market volatility in October in years when polling showed a particularly tight race. However, the data doesn’t appear to bear that out. There are some years in which a close presidential race was accompanied by an unusually volatile October, as was the case in 2000. But we also know that this was during the dot com bubble. Four years later in 2004, an even tighter presidential race (at least based on the final polling) saw significantly less market volatility. Meanwhile, October 2020 was much more volatile than October 2016, even though the polling averages showed a less competitive race in 2020. Of course, this was also during the COVID-19 pandemic, suggesting that volatility or lack thereof has less to do with the competitiveness of the race for the White House than the existing market environment. While we typically expect to see some volatility around election season, the data suggests that we shouldn’t expect an outsized increase this year just because of a close contest.”
My takeaway is market conditions are much more important than politics and our base case remains intact: once election uncertainly has passed, expect a strong end-of-year rally. Republican or Democratic administrations will deliver comparable results over the intermediate and long terms.
Use any market hesitation to buy the dips in growth, technology, industrials and interest rate sensitive sectors.