Lance Roberts, JC Parets, and Ryan Detrick have all pointed out recently the warning signs of narrowing of market breadth and the soldiers leaving the field to let the generals fight on. Rightfully so — these are all thoughtful market commentators and in the past, this has been a warning sign.
Indicators important to this are the New York Stock Exchange Hi-Lo and the OTC Hi-Lo, which we will focus on today. One can also use the Advance Decline lines of each universe, but that takes more interpretation.
Let’s take a look at the sentiment over the past 6 months what the Hilo’s were telling us.
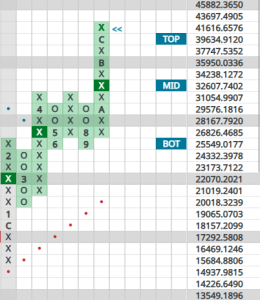
A Point & Figure tool, the Hi-Lo first counts the total number of stocks making either new highs or new lows. It then plots the number of stocks making new 52-week highs as a percentage of 100. For example, with the NYSE Hilo current reading of 60, 60% of stocks are making either new yearly highs or lows are making new highs. It is a terrific short-term measure that is important to our work here at Granite Wealth.
With the indictator currently having actually pulled back recently, the reading is roughly in balance and at mid field — in other words, nowhere near overbought despite indices making new highs. This has historically given a good snapshot of overbought/ oversold conditions and can be most useful at market extremes. Historically, the Hi-Lo indicators have offered reliable signals to mark opportunistic entry points. Not so much on the exits.
The NYSE Hi-Lo Indicator
The October 2023 bottom is the first red underline (ending a long column of 0’s signifying a decline). The next red underline shows action during this year’s April/ May drawdown. The last red underline shows current status of this indicator.
Subsequent action following extreme lows shows a reversal into a column of X’s (signifying a rise) in the number of stocks making new 52-week highs. We have seen this narrowness before. It tends to surface when the market is experiencing broad drawdowns, with some delay. Observe similar patterns after the April/May drawdown.
The OTC Hilo indicator shows similar action. However, as a proxy for the growth / value debate, the natural volatility and higher beta exhibits more exaggerated moves. BTW, we have written about market leadership of value and growth previously and we remain firmly invested in the growth camp.
The elongated decline at last year’s October bottom took this indicator to 6 — only 6% of NASDAQ stocks making new record readings were making new 52-week highs. Such washed out conditions have always offered excellent entry points. After the broadening of the early year rally, it reacted to the April/May speedbump with a retreat to 20 and currently resides at 42. Compare that to the NYSE Hilo’s 38 reading in April and currently at 60 — higher beta at work on this tech-heavy exchange.
Can a buying opportunity happen again?
Yes, this would be our base case as we head into the between-earnings season while also considering traditional election year expectations. In short, investors can still expect a broadening rally that will include more foot soldiers in lieu of only generals. First, however, expect a period of marking time before this arrives… our best guess is the late July / early August period. Use the time between to add to your favorite sectors. Ours are Technolgy, Restaurants and Building.