We wrote recently that it was 15 years ago when the Great Recession market collapse ended.
In another recent post, I also addressed the overwhelmingly bearish sentiment of the AII survey.
Against the backdrop of today’s volatile headlines, I have been on the lookout for emerging green shoots. From the perspective of a technical analyst, what does the emergence of green shoots in animal spirits look like?
Well, recent action gives an opportunity to answer that question.
After having reached oversold levels, short-term Point & Figure technical indicators have in fact reversed up, giving the stock market its first breakout buy signal. For now, this is simply an alert. A Bull Alert.
Two short-term indicators I follow closely are the HILO (the number of stocks making new 52-week highs as a % of 100) and the 10 Week Moving Average (stocks that are above their 50-day moving average as a % of 100).
We sometimes see these indicators reverse up into Bull Alert and then reverse back down into a column of Os, an outcome we commonly refer to as a re-test.
Such re-tests don’t always occur but when they do, they allow for a more clear buy signal to emerge: if the subsequent rising column of Xs breaks above the one that triggered the alert, it confirms that the supply of sellers has dried up and that demand is again in control. Hence the name: Bull Confirmed.
This combination of waning sellers alongside the emergence of new buyers is what puts it into Bull Confirmed status, giving us more confidence that a bottom is in.
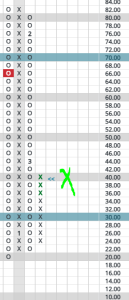
The current HILO chart shows the reversal from 22 (22% of stocks making new 52-week highs) to 40 (40% of stocks making new 52 week highs), thus Bull Alert.
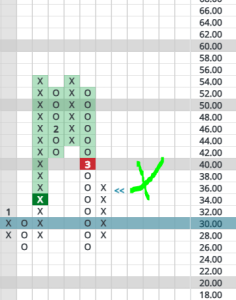
Same story for the Stocks Above their 10 Week Moving Average:
We have seen past bottoms play out just like this, sometimes over an extended period. After the second reversal up and a subsequent second buy signal, indicators go into Bull Confirmed status. This gives us much more confidence to think a rally has legs.
What was the action of these indicators was 15 years ago, for instance?
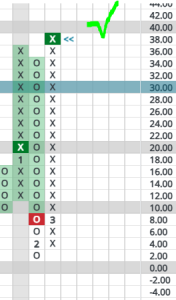
Here is the HILO in March of 2009. The last column of Xs on the right put it in Bull Confirmed status:
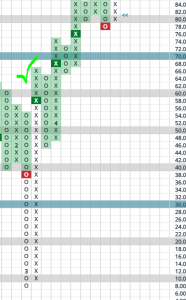
From that same period, here is the Stocks Above their 10 Week (50 Day) Moving average. Bull Confirmed status was achieved when the column of X’s printed 58 (meaning 58% of stocks were above their 50-day moving average):
Will it be different this time with the tariffs denting corporate earnings?
Is the Roaring 2020’s going to survive this head-spinning round of policy changes out of Washington?
At this point, the Bull Alert reversal makes us optimistic but final judgment is being held in reserve.
What I can say is that when Bull Confirmed status arrives, odds will be very good that we have bounced off an intermediate bottom.