The primary conversation over the last year has been, far and away, inflation, and the Fed Funds Rate as a result. Sure, we’ve heard the equities and bonds markets discussed widely, as well as the real estate market, both residential and commercial, but mostly through the lens of inflation and the Fed Funds Rate. We’ve also made predictions on where it will all go, though we know the predictions business is exceedingly difficult these days, particularly at the rate at which information travels.
Much of what is SAID by the Fed, particularly Jerome Powell, has had huge impacts on the markets – with the equities and bond markets reacting ahead of, during, and after any Fed communication, attempting to price in all data in real time.
An important metric outside of the Fed chatter is the 2-year US Treasury Yield (2yr UST), which is looked at as a natural barometer of where the Fed Fund Rate is going – a forecasting proxy, if you will. You can see in the chart below the direction of both the Fed Funds Rate and the 2-year US Treasury yield are very similar, ebbs and flows in the same directions.
Here’s the big takeaway right up front:
In the last 40 years, when the 2-year UST fell beneath the Fed Funds Rate by 50 basis points or more, the Fed has cut interest rates within 1 year.
One key piece of the 2-year US Treasury Yield is its tendency, as I mentioned, to act as a forecasting proxy for the Fed Funds Rate. It has the appearance of “pulling” the Fed Funds Rate in the direction it’s already on.
Looking at some examples of this more closely from the last 30 years, we can see this at play, and, more importantly, the timing of declines in the 2-year US Treasury Yield preceding a halt in rising Fed Funds Rates, or their eventual decline.
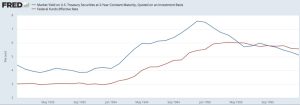
This example from the Clinton years and pre-Y2K of 1993-1995 shows the 2-year dragging the Fed Funds Rates higher, with the 2-year beginning its decline late in 1994, while Fed Funds Rate slowed its climb until early 1995, eventually declining around the time the 2-year dropped below the Fed Funds Rate.
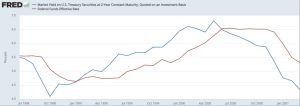
In Q3 of 1998, we saw the 2-year plummet more than 100 basis points (bps) below the Fed Funds Rate, though even before that point, where the 2-year was more than 50 basis points below the Fed Funds Rate, we saw the Fed’s decrease the rate. We see this again on the same chart in October 2000, with the 2-year continuing to pull the Fed Funds Rate downward through early 2001.
Leading up to the GFC, the 2-year dropped below the Fed Funds Rate for over a year starting in the summer of 2006, with marked Fed Funds Rate declines happening after the 2-year dropped to 50bps below the Fed Funds Rate.
Late 2018, when the Fed Funds Rate was still increasing, and caused the Christmas Eve Meltdown of that year, showed a flattening and subsequent declining of the 2-year UST, eventually more than 50bps below the Fed Funds Rate around June 2019. In July 2019, the Fed began cutting rates through the end of the year.
The current Fed Funds Rate is 4.75%, and much talk has surrounded the likelihood of a 50bps rate hike soon, though at least a 25bps hike, with a handful more hikes ahead of us (at a minimum). The 2yr UST just dropped from 5.05% to 4.03% in the last five business days – 100 basis points (!) – so this is well past the 50bps spread we look for when the 2-year is below the Fed Funds Rate.
We assess that this decline in the 2-year is indicative (and complimentary to other factors) to the way ahead for the Fed regarding their rate, meaning the Fed very well might have been forced to relent on the rate hikes… at least for now. While there are a myriad of other factors at play (employment numbers, real estate markets, etc.), the 2-year’s action will likely remain a strong barometer for a near-term understanding of Fed Funds Rate movement, and subsequent market price action. The Fed may be done for now, though rate cuts are probably still on the distant horizon.