**UPDATE post-earnings (written morning of 8/29):
Well, NVDA sure had a wild ride in the thin after hours trading session following earning. I saw it as low as $114. In today’s regular session it’s a different story, as investors take a second look at the report.
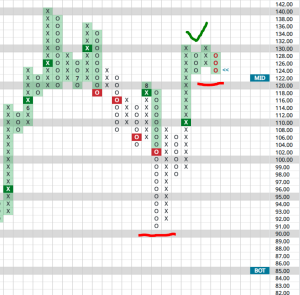
Little technical damage has been done. Expect some backing and filling around the Mid point of the trading band around $122.
In fact, an interesting Point & Figure chart pattern may be developing: a shakeout. This involves a break below initial support levels, followed by a reversal back up. In this case, a move above $126 would heighten this possibility and an upside breakout at $132 would confirm that a shakeout has indeed taken place.
Watch for this to line up as it is one of the most reliable chart patterns, statistically.
**Original Post:
Market predictors are telling investors to expect a potential 10% move up or down in reaction to earnings.
Our view is key upside breakouts are just ahead at $132. If NVDA prints this tomorrow — but not in the thin after-hours spectacle — then a possible move to recent highs of $136 and $140 is likely. Further, such a move would set up for a longer-term price target of $195.
How likely is that?
In the short run, not very. There are plenty of headwinds to battle, such as the end of the month of August, historically brutal September market performance and next Fed meeting decisions. Our view is that NVDA could approach more bullish targets late in the 4th quarter, concurrent with a robust Election Year rally.

What about the downside levels of support to monitor?
A breach of the $122 support would be mildly concerning, any subsequent breaches of $98 and the recent $91 low (and a print of $90) would be very concerning. That could lead to a decline to the bottom of its trading band at $85.
Certainly, there will be a lot of eyeballs on the report. Don’t fall for the head fakes of the afterhours prints.


