The 50-Day Moving Average: A Reliable Indicator?
A recent headline on MarketWatch blared: “S&P 500 flashes a warning that stocks are likely headed lower after breaking below its 50-day moving average.”
So frightening!
…but is the market moving below its own 50-day MA truly a cause for alarm? I’ll let you be the judge.
As one example, let’s look at the last time this happened, which was in February of this year:
- On February 26th, the S&P moved below its 50-day moving average
- By March 5th it was back above
- It fell back below two days later (March 7th)
- Finally, the index moved back above this line on March 29th, where it had stayed until this week
That first breakdown below the 50-day moving average was right at 4000 on the S&P. Given that we are fully 11% higher today, despite the sell-off over the past week, was that break below the moving average a good time to sell?
How about if one had bought/sold in a frenzy each time the market crossed above and below its own 50-day over the course of that month?
Terrible idea, obviously.
And the truth is, there have been countless false signals in the 50-day moving average throughout its history; a headline declaring that investors should sell based upon it is doing readers no favors whatsoever.
While we’re on the topic, another moving average indicator folks seem to get wrapped up in is the dreaded “death cross,” which occurs when this same 50-day M.A. crosses below the index’s 200-day moving average.
Last time a death cross happened: late March of 2022, as the market was beginning last year’s multi-month sell-off. Nailed it!
The time before that, however? March 30th of 2020, one week after the S&P 500 had touched a low of 2200. Investors who sold based on that death cross would have missed a 100% rally over the ensuing 18 months.
In other words, following moving averages alone is simplistic to the point of being absurd.
Now, because these indicators are watched by many market participants, it’s not as though they have zero value. In fact, it might be argued that the golden cross signals may be most useful to short term players like ODTE traders. Meaning? Know your holding period. Have a game plan.
If that gameplan is long-term in nature, however, it’s best to take a more comprehensive view of trading and follow different technical indicators that provide a more accurate picture of supply and demand.
In our methodologies, moving averages are secondary factors, being short-term oriented by definition.
More important in our view is the overall trend of the market (which remains positive), as represented by the Bullish Percent I frequently write about, plus the trends of the market’s leading sectors.
We wrote in July to expect a consolidation of the uptrend, that this would probably be the pause that refreshes. We still expect that. This week’s consolidation could have been brought about by worrying geopolitical events, investor exhaustion, Fed fears — take your pick.
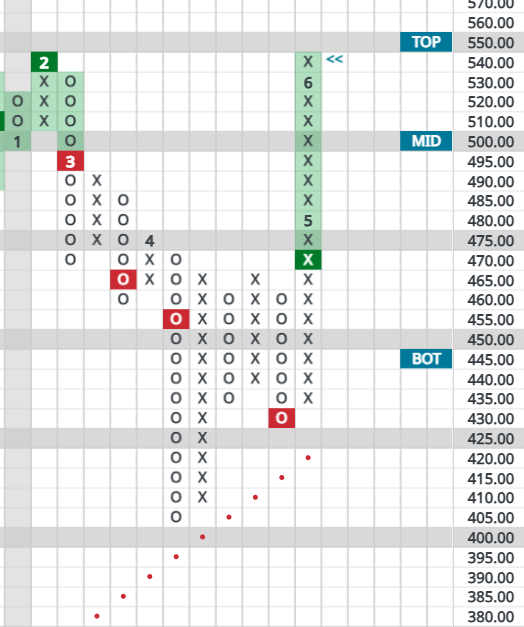
The S&P has experienced a 4.5% drawdown so far, right smack in the middle of its trading band. In our view, there remains possible downside risk to the 4320 support level.
Does this give short-term traders an opportunity to play the downside? Perhaps, although we may well be along on the drawdown — as panting, bearish headlines signal a welcome fearfulness that returns quickly every time the market hiccups.
Undoubtedly, we’ve seen a great rally this year so we need to be on guard in order to protect profits.
To believe a serious downturn might be at hand, we would become concerned if the initial 4320 support is broken. Further cause for alarm could come either from subsequent breaks of key levels below 4320, OR from a small bounce followed by a lower-low, reversing the trend of higher lows we’ve seen through most of 2023.
In summary, we are aware of all the headlines giving fundamental reasons for concern and we’re watching closely for signs the uptrend has indeed ended. But market action needs to be read using a variety of indicators that truly suss out the supply and demand picture, not just one short-term, simplistic moving average.