Part I of this series took a focused look at Amazon (AMZN). Part II was a quick rundown of five of the Mag 7 stocks.
In this final installment, this morning we slow it down once again to take a closer look at perhaps today’s most popular stock. We’ll focus on earnings and will also explain once more why the coupling of good technical analysis – when done correctly, the study of the battle between supply and demand – adds a vital component that most investors simply miss.
When a stock is as high-profile as Nvidia, everyone has an opinion.
Some will take a bearish view based on a recent headline like this one, which discusses the overheating issues the company is facing with its next generation GPUs. It’s certainly a development to monitor, but one possibly temporary issue like this is unlikely to derail such robust growth.
Others might latch onto the impressive rate of continued earnings growth and conclude that NVDA has much further to run. Perhaps, but even though we have remained bullish and the stock remains the largest holding across our clients’ portfolios, weeks ago we warned that comps would get more challenging and reminded investors that trees don’t grow to the sky.
If even we’ve been mindful since June of the challenges facing NVDA – a potential victim of its own success, in a way – how did we manage to stay in?
Because the technical action never told us to sell. In the battle of supply and demand, buyers (demand) have remained in control.
So what does our style of technical analysis say about NVDA today, the morning after yet another headline-making earnings report?
In after-hours session following yesterday afternoon’s release, the stock was down. It’s a great reminder that investors need to be careful about reading too much into the action that takes place in those illiquid sessions.
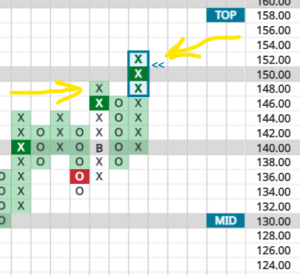
Why? Because with today’s print above $152, NVDA not only reached a new all-time high, it completed one of the most reliable positive chart patterns, a Bullish Catapult. A catapult takes place when a triple top breakout is followed immediately by a double top breakout, which I’ve highlighted in the chart below:

One of the goals of Point & Figure charting is to slow the stock’s action down and to filter out the noise of very short-term movements. This is why we require a 3-box reversal to change a stock’s column from X’s to O’s (rising to falling).
Also, and this is important, we only update the direction of the stock once per day – another way of slowing down the signals. As I finish writing this post mid-morning Eastern time on November 21st, NVDA is back down a couple dollars on the session. No matter: because it was already in a rising column of X’s and printed above $152, that’s why the latest proper update of its P&F chart looks like it does.
If it stays in the low $140s the rest of the day, then opens and trades there again tomorrow, the chart will be updated and could fall back into O’s.
That wouldn’t worry us, however, due to the powerful and reliable bullish catapult. Indeed, it could make for a nice trading point entry because the catapult suggests a short-term upside target of $178, according to our analysis.
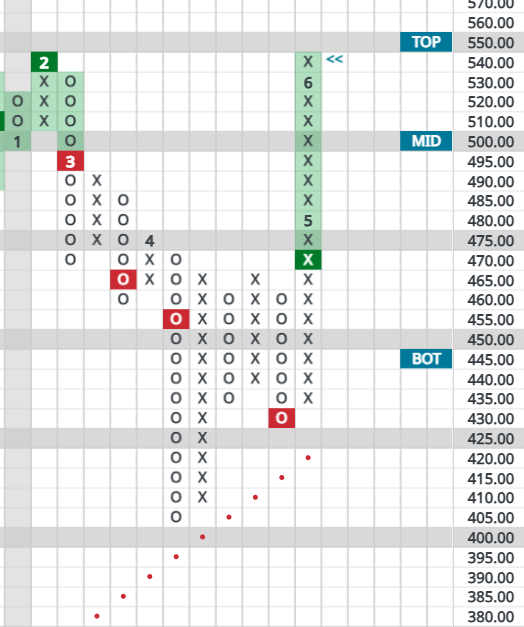
For anyone needing a little more peace of mind regarding how this popular stock might trade over the next few weeks, here is a reminder of how NVDA has traded immediately following earnings:

Over the past two years, only once was this stock down two months after an earnings report.
Again, everyone has an opinion on NVDA but keep in mind: when people discuss earnings, competition, P/E ratios and the like, they’re discussing aspects of fundamental analysis, which helps decide what to buy.
Good technical analysis helps decide when.
As we said weeks ago, trees don’t grow to the sky and one day there will come a time to sell some or all of NVDA.
For now, however, we’re sticking with this particular beanstalk.


